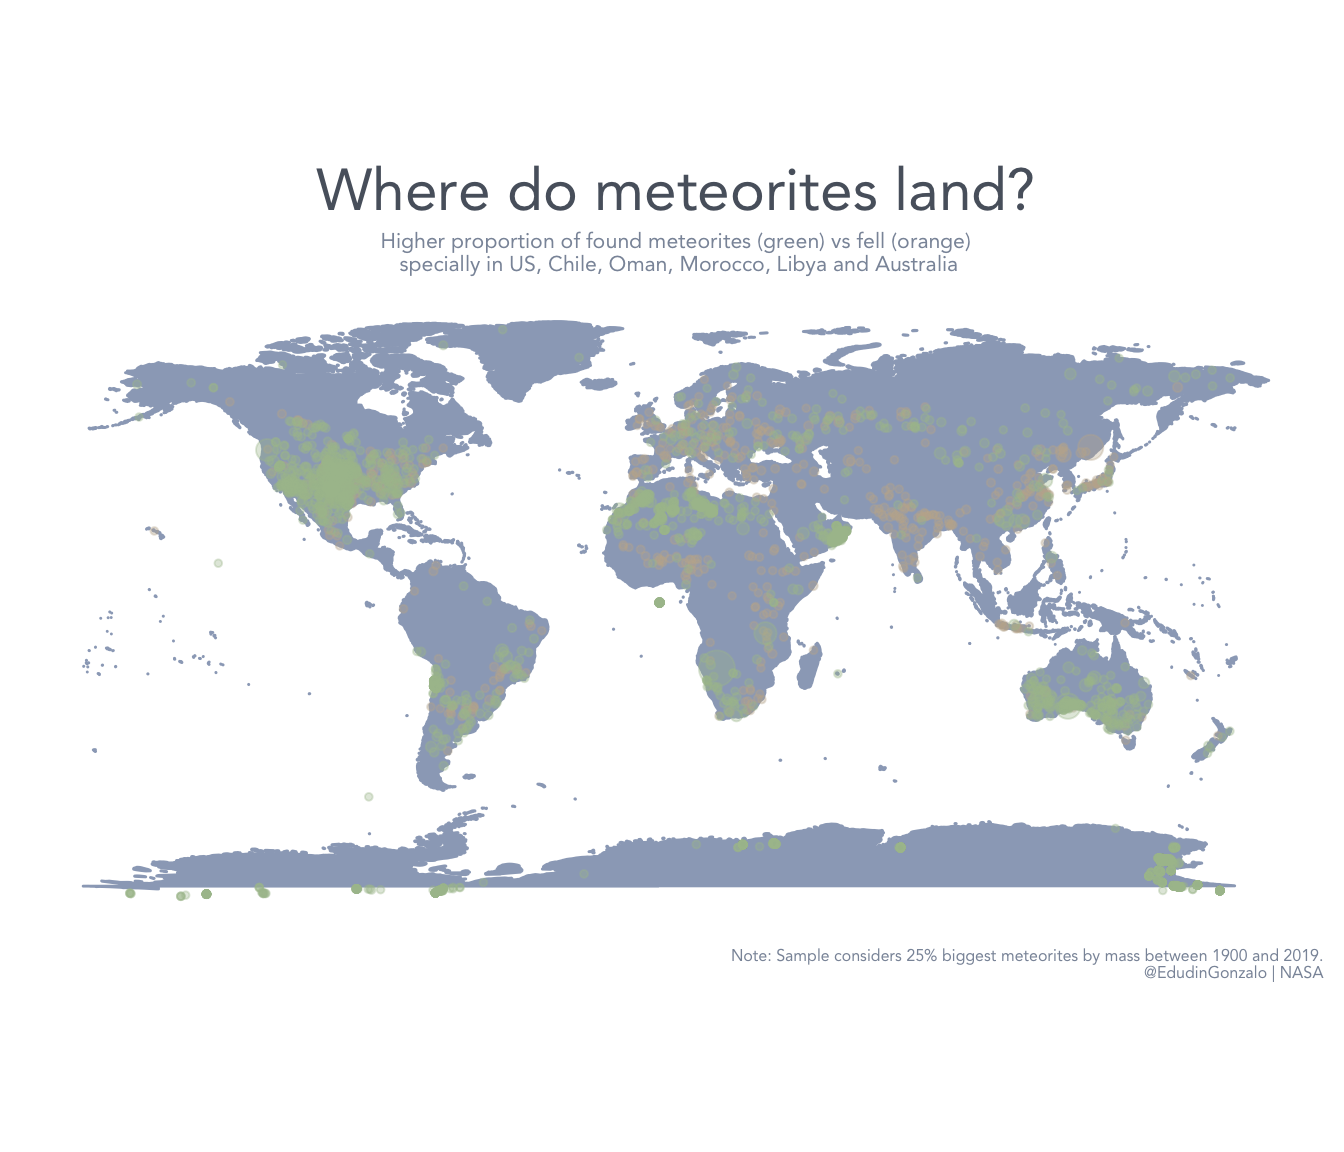
Student to teacher ratios in Europe

A measure to define the quality of education is the number of students per teacher. In this tidytuesday project I use data from the UNESCO to visualise the differences among European Countries. As it happens with other domains, such as health, there are significant differences depending on the type of education considered. The plot is a good example of how to represent different levels of a factor in a faceted ggplot. [Read More]

How should you call your pet ...

… if you live in Seattle? The tidytuesday project from this week can give you some hints in case you feel undecided. I produce a heatmap with geom_tile() to see what are the most common names for pets in Seattle and whether there are some periods during the year that are more popular than others. There are names, such as Lucy, that seem to be everlasting for dogs and cats. Others, such as Daisy, Luna or Bella present more seasonal patterns. [Read More]

Women and salaries

The 8th of March is the International Women’s Day. In this week’s #tidytuesday I use data data from the Bureau of Labor Statistics and the Census Bureau to plot the gender gap in earnings of women workers in the US from 1979 to 2011. I use gganimate() to illustrate this difference in salaries between men and women over time and by age ranges. The gap (i.e. less female salary percent of male salary) increases at older ages. [Read More]

SNCF trains

A good thing from France is the wide network of trains over the whole country. The company in charge of their management is the SNCF which is state-owned . This week the #tidytuesday challenge consisted of plotting information regarding the the trains. The dataset is quite complete and there are several options for the representation. My choice for this plot is to represent the variation over time in the number of lines covered by each station. [Read More]

PhDs in the US

Finally I got myself into the #tidytuesday. This project, promoted by R for Data Science, aims to enhance the manipulation and visualisation skills among the R community by the exploratory analysis of a raw new dataset that is posted on a weekly basis. Apart from improving the #RStats skills, the idea of this project is to enable connections amongst the #Rstats community, explore other´s work and get feedback. The data for this week consisted of sample of PhDs awarded by field in the US. [Read More]

El 2018 en el Congreso español

La semana pasada arrancaba el año en el Congreso de los diputados. El 2018 dejó varios momentos que sin duda serán carne de hemeroteca. Entre los episodios con más seguimiento mediático destacaron la aprobación de la primera moción de censura contra un gobierno en democracia o la expulsión la expulsión forzosa de un diputado del hemiciclo por su comportamiento (el segundo de la democracia). Pero, qué otras cosas caracterizaron la actividad parlamentaria durante 2018? [Read More]

Mapping the quality of adult social care

A key element for a health system is the quality of their services. Knowing how good (or bad) health centres are doing may be useful for policy makers to assess their performance and propose improvements. For other services such as residential and nursing care homes, quality is an important aspect to motivate the choice of certain premises over others. In this post I look at the quality of care homes. [Read More]

Animating administrative data

Looking at ageing in the English population

England as other developed countries is ageing. Is this process going to increase, stabilise, decrease …? The Office of National Statistics regularly releases information on population trends. In this post I look at the old-age dependency ratio (OADR) which represents the people aged 65 and over for every 1,000 people aged 16 to 64 years (“traditional working age”). The process is relatively nice and easy. It consists of three core steps: [Read More]

What is this about?

After several attempts I am finally deploying a website. This has been a long journey of trial and error where I have two main sources: This post by Allison Presmanes and this video by John Muschelli. The idea of this website is to contribute to the community and show case studies that may be helpful for some. You are likely to find a bunch of things associated with care homes, ageing and long-term care in England. [Read More]